Elgin Observatory
HOME


Determining Periodic Error (PE) in a scope drive


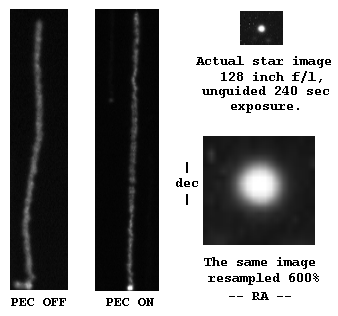
Just in case you feel that using Periodic Error Correction (PEC) is too much trouble, here is pictorial evidence of just how effective it is. These images were taken with my f/8 8" Newtonian with a 2X barlow, giving an effective focal length of 128". The scope is on an equatorial mount so all the tracking is on the RA (az) axis. The Dec axis was given a fixed drift during the exposures. Each image was 60 sec, long enough for a full PEC cycle.


The following describes the steps required to analyze PEC data and create a PEC.DAT file. The data are acquired by using the PEC function of Mel Bartels' Scope.exe program.

Getting PEC Data, Remarks by Chuck Shaw

After taking several runs of guide data import the data into your spreadsheet program. (Note: The newer versions of the program synchronize the indices; Thanks Mel.)

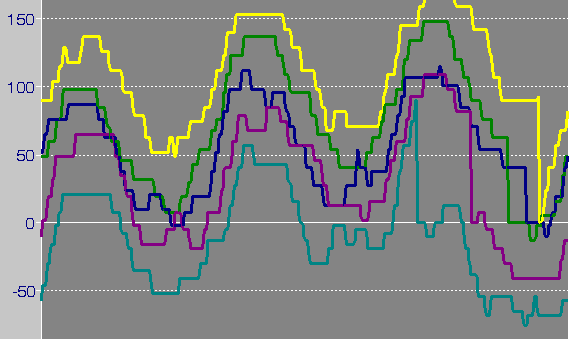
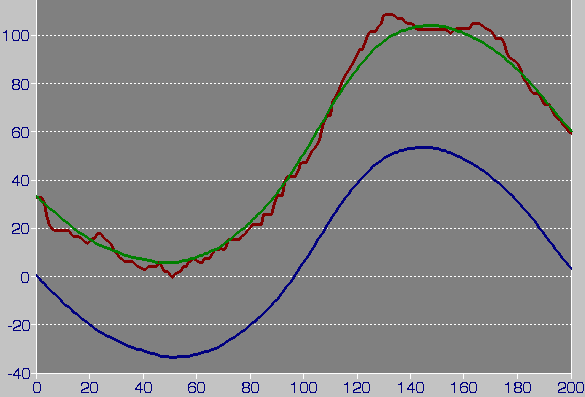
The data should look something like this:

The next step is to take the arithmetic average of the data for each index point.

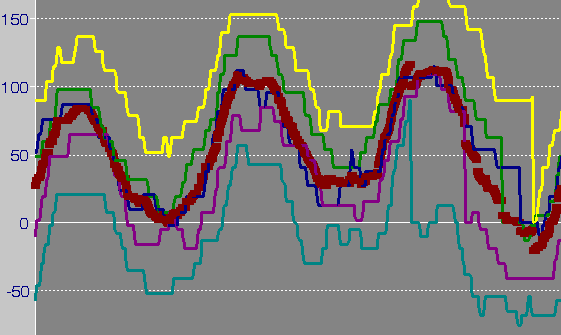
The averaged data will look like the heavy red trace:

The data can be further smoothed by taking a running average across the set of averaged data. The running average will probably require a width of 30 or more points. This width smooths the data well without serious distortion of the curve, as seen in the following:

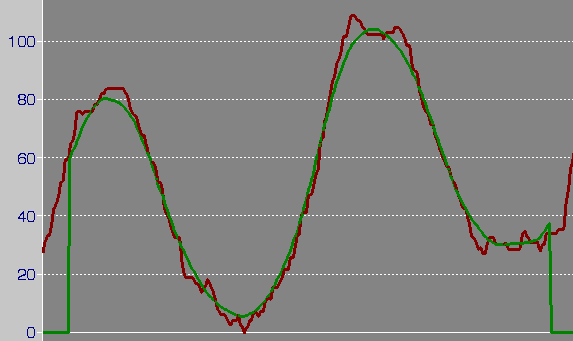
However the running average will have the effect of clipping the amplitude of the PEC "wave". [After centering the wave amplitude on zero (by adding or subtracting a constant to balance the maximum and minimum around zero, you can multiple each value by a small factor to restore the "clipped" high/low, see below.]


For a running average with a data width of 40 points, you will have to add 20 data points at the beginning and 20 at the end of your data set. To accomplish this, copy data for points 0 thru 19 to the end of the set, labeling them with index numbers 200 thru 219. Then insert the data points for indices 180 thru 199 at the top of the data set, labeling these with index numbers -20 to -1


The newer versions of Scope.exe automatically correct the PEC data for drift, so the following step is not normally needed.

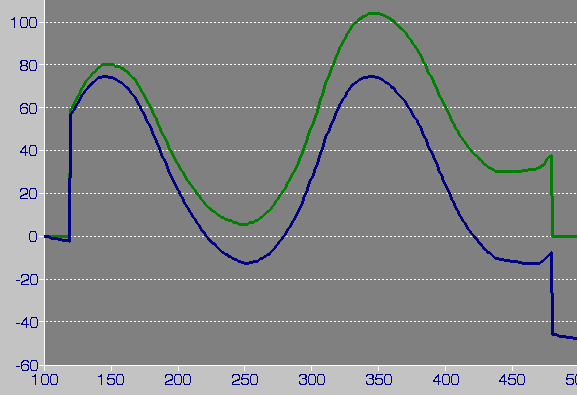
Looking at the data presented above, it is apparent that there is some drift in the tracking due to the inaccuracy of the scope alignment or other tracking error. This drift must be removed. If it were to be added to the PEC data, it would cause a discontinuity at the end of each cycle. Furthermore the actual PEC would be distorted by the drift.

Examining the data, it can be seen that from one peak to the next and from one minimum to the next, the drift is consistently 24 counts per cycle.

The drift for each data point is the drift per cycle divided by 200 (assuming 200 steps per cycle). To eliminate the drift add (or subtract as required) this amount multiplied by the index # from each data point. The equation for this example is:

Drift Corrected Data = data - (24/200) x Indx#
where Indx# is the consecutive index for Data.

NOTE: You need to adjust the data for drift BEFORE creating index values -19 to -1 and 200 to 220.

The result for drift correction appears as follows:


The data now will work, but some final adjustments can be made.

First adjust the PEC data so the absolute values of the max and min are equal, i.e. balance the data around zero. This is done simply by adding (or subtracting) the same constant value to each data point such that the absolute value of the minimum equals the value of the maximum; thus:

The data can now be "stretched" to undo the "clipping" caused by averaging the data.
In the above data it appears that the peak of the curve is about 4 counts below the averaged data peak. The amplitude of the curve is +/- 40, so multiplying each data point by 1.1 will make the maximum (and minimum) data values 44, more closely matching the original data.

You can now create the PEC.DAT file. As stated in the SCOPE.exe manual, this is a simple text file with the index number and its corresponding pec value listed line by line from 0 through 199 for each axis, the dec axis is listed then the az axis is listed.

___________________________________________________________________


The following remarks are by Chuck Shaw
regarding his experiences in nulling Periodic Error

Return to Data Analysis
Chuck Shaw:

I recently finished converting my 14.5"f/5 dob into an AltAz system using Mel Bartels' plans and software. I also just went through coming to grips with nulling out PE (periodic error) and I have a few "lessons learned" that might be helpful....

1. Use LOTS of power when running in Guide mode to build Guide.dat I used two barlows stacked into each other (a 1.7x and a 2.8x and a 12mm illuminated reticle eyepiece and an ~1808mm scope gives about 720x...... use AT LEAST that much if you can.... (Slightly de-focused blobs are easier to guide with than points anyway!!)... You ARE using an illuminated reticle Eye Piece aren't you??? Do not try to keep a focused image of the star in the center of the box. Either de-focus till the star fills the box, or put the star in the center of an intersection of two lines, or put it in a "corner" where its just touching two lines. Try different techniques to see which works best for you. I found the biggest source of inconsistencies in my data sets was ME and my poor guiding!!!!!! My reaction times usually had the wrong direction and were late..... (duh......) :-) Play with the orientation of the hand-paddle also to see if a "fly to" type of guiding is easier.....

2. Use the guide routine several times to nail the drift as well as possible BEFORE you try to write a file to capture PEC data.

3. For Azimuth data collection, be sure and aim the scope due south, near the celestial equator. This will minimize motion from Alt, and maximize the motion in AZ....

4. Shell out to DOS without stopping tracking after a Guide run, Do a "copy c:\guide.dat PE-AZ1.txt", then a copy "c:\PEC.txt guide.dat" (say YES to overwrite) , then type exit and SHAZAM the scope will slew back to the star you were guiding on and you are ready for another run!!!!! Name the next file PE-AZ2,txt, etc...... This allows you to capture several runs very quickly, and any system config changes between runs are minimized.

5. VERY CLOSELY inspect for any "wobble" in your worm bushing. I use 359:1 Byers gears. I had to make the bushings for the worms and discovered the bushing has a tiny bit more slop than it should (the clearance is about 0.001 and Byers tells me it should be about 0.00005). I decided to fabricate a "tailstock" out of a small aluminum angle and a brass machine screw. I ground a point on the end of the machine screw and it goes thru the bracket and presses into the center ground dimple in the end of the worm. That made a HUGE difference in obtaining repeatable data. I think the problem was the worm's wobble was somewhat random. That, in turn changes the mesh slightly, and that induces PE.... If your worm is on a shaft with bearings/bushings at both ends, you still need to look for this!

6. Look at the couplings for the motor to worm. If they are flexible and you are using the motor bearings to stabilize the worm at all (if there is slop in the bushings you are in this category), you need to go to a precision coupling. I bought several commercial ones and found they were slightly out of round!!!! This in itself introduced PE!!! That's OK though, since the Software will compensate for it.

7. Re-initialize the motor/worm positions in between runs to make VERY sure that you know what position corresponds to the 0 position in the guide.dat data I failed to do this a couple of times and got accurate but skewed curves..... You have to remember to turn off PEC and then back on after the shafts are positioned !!!!!!

8. Remember the data take will NOT start at zero unless you time it that way. Do not try to get cute and time it, just start it and use your spreadsheet program to cut the four runs of data into separate columns and then move them up/down in the spreadsheet to line up the steps in each run. Then delete the step number columns (all but the far left one). Graph the 4 curves and throw out any that are obvious guiding errors. Then average the rest and you are there!!!

9. Remember after the data file is copied into a file called PEC.dat to re-initialize the shafts to their zero position. I keep forgetting to do this!!!! The system also seems to get lost after a couple of hours of operating.... An occasional reinit of the PEC alignment takes less than 15 sec and helps "clean up" things. I should not have to do this but......


I was having inconsistencies in taking data initially, and had phase skewing till I stabilized the worms .... perplexing, but a methodical working on each potential source of PE will find the culprit!!!

The performance of the system is simply astounding when all is completed.....

Keep in touch, there are more and more of us building these systems and its really fun to learn from each other!!!

Chuck
Return to Top of Document